This is the multi-page printable view of this section. Click here to print.
Ops Guides
- 1: Deployment
- 2: Monitoring
1 - Deployment
You can deploy the Chall-Manager in many ways. The following table summarize the properties of each one.
| Name | Maintained | Isolation | Scalable | Janitor |
|---|---|---|---|---|
| Kubernetes | ✅ | ✅ | ✅ | ✅ |
| Binary | ⛏️ | ❌¹ | ❌ | ✅ |
| Docker | ❌ | ✅ | ✅² | ✅ |
- ✅ Supported
- ❌ Unsupported
- ⛏️ Work In Progress…
¹ We do not harden the configuration in the installation script, but recommend you digging into it more as your security model requires it (especially for production purposes).
² Autoscaling is possible with an hypervisor (e.g. Docker Swarm).
Kubernetes
Note
We highly recommend the use of this deployment strategy.
We use it to test the chall-manager, and will ease parallel deployments.
This deployment strategy guarantee you a valid infrastructure regarding our functionalities and security guidelines. Moreover, if you are afraid of Pulumi you’ll have trouble creating scenarios, so it’s a good place to start !
The requirements are:
- a distributed block storage solution such as Longhorn, if you want replicas.
- an OpenTelemetry Collector, if you want telemetry data.
# Get the repository and its own Pulumi factory
git clone git@github.com:ctfer-io/chall-manager.git
cd chall-manager/deploy

# Use it straightly !
# Don't forget to configure your stack if necessary.
# Refer to Pulumi's doc if necessary.
pulumi up
Now, you’re done !

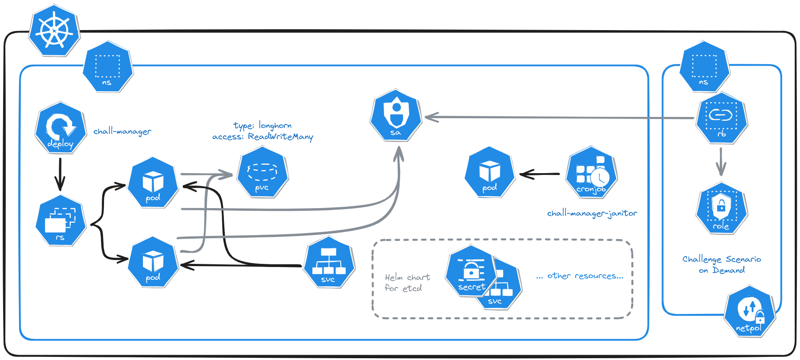
Micro Services Architecture of chall-manager deployed in a Kubernetes cluster.
Binary
Security
We highly discourage the use of this mode for production purposes, as it does not guarantee proper isolation. The chall-manager is basically a RCE-as-a-Service carrier, so if you run this on your host machine, prepare for dramatic issues.To install it on a host machine as systemd services and timers, you can run the following script.
curl -fsSL https://github.com/ctfer-io/chall-manager/blob/main/hack/setup.sh | sh
It requires:
jqslsa-verifier- a privileged account
Don’t forget that chall-manager requires Pulumi to be installed.
Docker
If you are unsatisfied of the way the binary install works on installation, unexisting update mecanisms or isolation, the Docker install may fit your needs.
To deploy it using Docker images, you can use the official images:
You can verify their integrity using the following commands.
slsa-verifier slsa-verifier verify-image "ctferio/chall-manager:<tag>@sha256:<digest>" \
    --source-uri "github.com/ctfer-io/chall-manager" \
    --source-tag "<tag>"

slsa-verifier slsa-verifier verify-image "ctferio/chall-manager-janitor:<tag>@sha256:<digest>" \
    --source-uri "github.com/ctfer-io/chall-manager" \
    --source-tag "<tag>"
We let the reader deploy it as needed, but recommend you take a look at how we use systemd services and timers in the binary setup.sh script.
Additionally, we recommend you create a specific network to isolate the docker images from other adjacent services.
For instance, the following docker-compose.yml may fit your development needs, with the support of the janitor.
version: '3.8'

services:
  chall-manager:
    image: ctferio/chall-manager:v0.2.0
    ports:
      - "8080:8080"

  chall-manager-janitor:
    image: ctferio/chall-manager-janitor:v0.2.0
    environment:
      URL: chall-manager:8080
      TICKER: 1m
2 - Monitoring
Once in production, the chall-manager provides its functionalities to the end-users.
But production can suffer from a lot of disruptions: network latencies, interruption of services, an unexpected bug, chaos engineering going a bit too far… How can we monitor the chall-manager to make sure everything goes fine ? What to monitor to quickly understand what is going on ?
Metrics
A first approach to monitor what is going on inside the chall-manager is through its metrics.
Warning
Metrics are exported by the OTLP client. If you did not configure an OTEL Collector, please refer to the deployment documentation.| Name | Type | Description |
|---|---|---|
challenges | int64 | The number of registered challenges. |
instances | int64 | The number of registered instances. |
You can use them to build dashboards, build KPI or anything else. They can be interesting for you to better understand the tendencies of usage of chall-manager through an event.
Tracing
A way to go deeper in understanding what is going on inside chall-manager is through tracing.
First of all, it will provide you information of latencies in the distributed locks system and Pulumi manipulations. Secondly, it will also provide you Service Performance Monitoring (SPM).
Using the OpenTelemetry Collector, you can configure it to produce RED metrics on the spans through the spanmetrics connector. When a Jaeger is bound to both the OpenTelemetry Collector and the Prometheus containing the metrics, you can monitor performances AND visualize what happens.

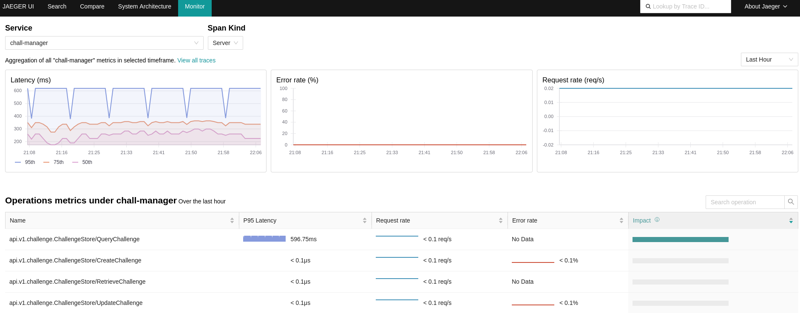
An example view of the Service Performance Monitoring in Jaeger, using the OpenTelemetry Collector and Prometheus server.
Through the use of those metrics and tracing capabilities, you could build alerts thresholds and automate responses or on-call alerts with the alertmanager.
A reference architecture to achieve this description follows.
graph TD
    subgraph Monitoring
        COLLECTOR["OpenTelemetry Collector"]
        PROM["Prometheus"]
        JAEGER["Jaeger"]
        ALERTMANAGER["AlertManager"]
        GRAFANA["Grafana"]

        COLLECTOR --> PROM
        JAEGER --> COLLECTOR
        JAEGER --> PROM
        ALERTMANAGER --> PROM
        GRAFANA --> PROM
    end

    subgraph Chall-Manager
        CM["Chall-Manager"]
        CMJ["Chall-Manager-Janitor"]
        ETCD["etcd cluster"]

        CMJ --> CM

        CM --> |OTLP| COLLECTOR
        CM --> ETCD
    end